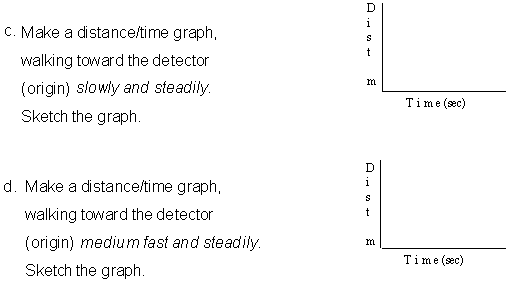
Activity 1 Making Distance-Time Graphs

1. Start Logger Pro 3.3.  Open the Folder "To PHY 183" and choose the file "walking.xmbl".  Be sure the Lab Pro is connected to the computer and turned on, and the motion detector is plugged into one of the Dig/Sonic ports.  (If the motion detector seems not to be working once you get to step 3, try moving the connector to the other Dig/Sonic port.) The motion detector works better if it is not near the computer or the monitor.

2. As you copy graphs from the screen, it is OK to ignore single spikes and smooth out little wiggles.  If you have lots of spikes, you should re-do the graph until it is reasonably smooth.

3. To adjust the distance reading, place the 2-meter stick on the floor in front of the computer; stand at the 2-meter mark on the number line and have someone click "Collect"; then move the meterstick (and yourself) until the reading is 2 meters.

4. Make distance-time graphs for different walking speeds and directions.


Questions

Describe the difference between the graph you made by walking away slowly and the one made by walking away more quickly. (Q1)

___________________________________________________________

___________________________________________________________

Describe the difference between the graph made by walking toward and the one made walking away from the motion detector. (Q2)

___________________________________________________________

___________________________________________________________

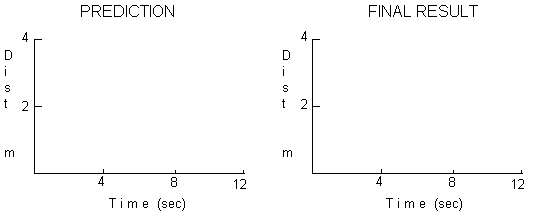
Prediction Predict the graph produced when a person starts at the 1-meter mark, walks away from the detector slowly and steadily for 4 seconds, stops for 4 seconds, and then walks toward the detector quickly. Draw your prediction on the left axes on the next page using a dotted line.

Compare predictions with the rest of your group. See if you can all agree. Draw your group's prediction on the left hand axes using a solid line. (Do not erase your original prediction.)

5. Do the experiment. Move in the way described and graph your motion. When you are satisfied with your graph, draw your group's final result on the right axes.

Question

Is your prediction the same as the final result? If not, describe how you would move to make a graph that looks like your prediction. (Q3)

___________________________________________________________

___________________________________________________________

___________________________________________________________

Tools for Scientific Thinking: Motion and Force 9/92 ©1987-92 CSMT Tufts U. These activities have been modified locally: 183LoggerProLab1(Motio).doc

Return to Experiment Main Page