RC Circuit and its Time Constant
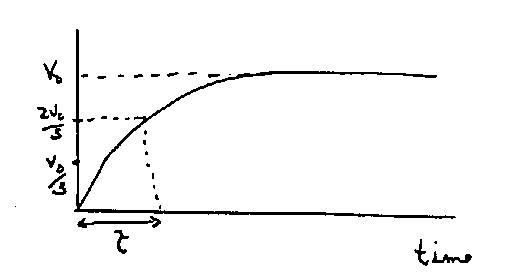
When a resistor, capacitor and battery are connected in series, the current is initially large. As the capacitor gradually charges, the current decreases. When the capacitor is fully charge (the capacitor voltage is equal to the battery voltage), the current is zero. We characterize this process by the "time constant" of the circuit. At the time t = RC the capacitor will be charged up to approximately 2/3 of its final value. This time is referred to as the time constant of circuit. The charging process is illustrated in the figure below showing a graph of capacitor voltage versus time. A graph of the charge on the capacitor would look the same.
Begin by measuring the resistance of each of your resistors. While the instructions will refer to the nominal value of the resistors given by the color code, you should use your measured values of resistance in the calculations.
Turn on your oscilloscope, set the controls properly for accurate time measurements, and find a trace. Use the oscilloscope to look at the output of the signal generator. Adujust the signal generator until you have 3 volt peak-to-peak square waves at a frequency of 500 Hz. This frequency is just a convenient place to start. You will vary the frequency as you make the measurements.
Connect a 2.7 x 10⁵ ohm resistor and a .001 µF capacitor in series with the signal generator. Use the procedure outlined at the end of these instructions to measure the time constant. Estimate the error in your measurement by thinking about how much you might reasonably be off in reading the scale.
Calculate the theoretical time constant. This number also has an error associated with it due to the inaccuracy of our knowledge of the values of the resistance and capacitance. The manufacturer of the capacitors guarentees the values to within 10%. The likely error in the resistances you measured is much smaller than that so we will ignore it. Thus, the percent error in your theoretical time constant is also 10%. Calculate the absolute error in your theoretical time constant. Do your theoretical and experimental values agree to within your errors?
Repeat the time constant measurements and calculations for the following combinations of resistors and capacitors:
Time Constant Measurement Procedure
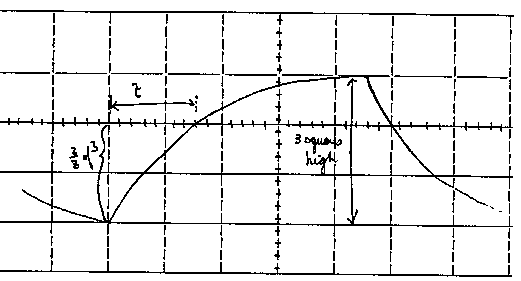
Adjust the oscilloscope display and square wave frequency to the pattern shown below. To do this, adjust your time/cm so that you have 2 or 3 complete periods on the display. If your pattern looks like a square wave with rounded corners, you need to increase the frequency on the signal generator. If your pattern looks like a triangle wave, you need to decrease the frequency on the signal generator. When you change the square wave frequency, you may have to readjust the amplitude to 3 volts.